Maricopa County's Trustee Sale Notices
Although I wasn’t completely convinced then, I think it’s getting a lot more difficult to question the evidence now.
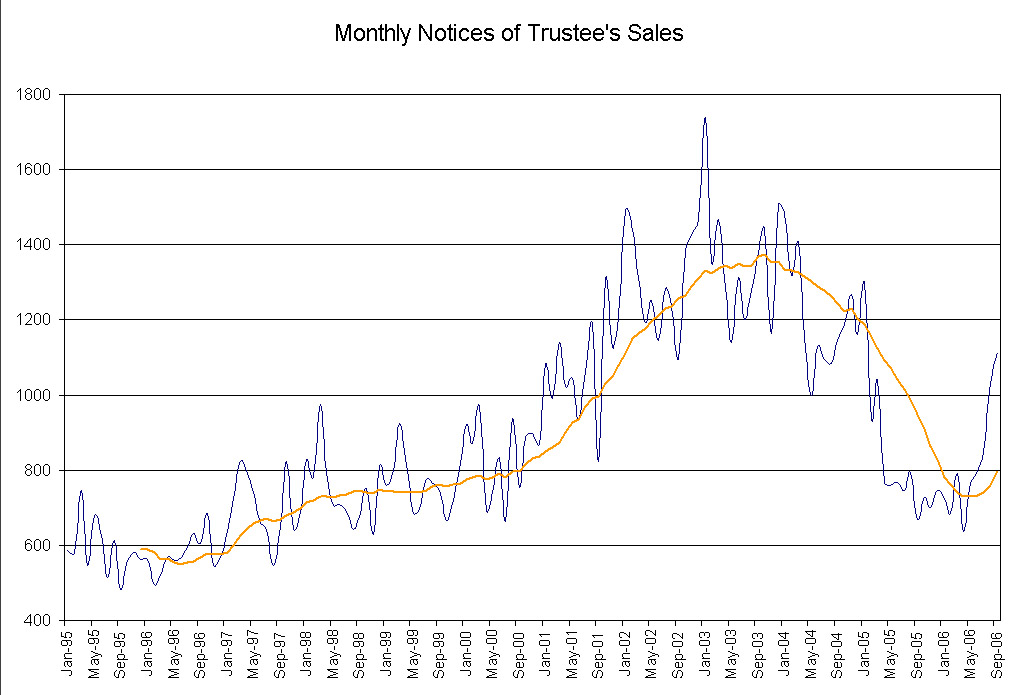
The graph below chronicles Maricopa County’s Trustee Sale Notices over the past 11 years. The blue line is the monthly count. As you can see, this number is pretty variable from month to month, so I’ve included the orange line, which is a 1-year moving average. Presumably it’s a better indicator of trends.
 Here are some descriptive statistics for the numbers in the graph:
| Mean | 902.382979 | |
| Median | 799 | |
| Mode | 746 | |
| Standard Deviation | 285.972168 | |
| Range | 1256 | |
| Minimum | 482 | |
| Maximum | 1738 | |
| Sum | 127236 | |
| Count | 141 |
Given that the past decade saw the bursting of the tech bubble, I think the mean is being skewed high, and thus the median and the mode are probably better indicators of a “normal” month in Maricopa County.
![]()


1 comment:
October is on track to top 1200
Post a Comment